Analyzing Maps
Document Presets
To download, choose the "Save as PDF" option when asked to choose a printer.
Primary Source Set
Analyzing Maps
One of the ways people understand space and geography is through the creation of maps. A tool used to document locations, maps began to be used by more and more people after the invention of the printing press in the 15th century. This primary source set provides examples of North Carolina maps from three centuries to show how the state and its geographic documentation practices have evolved throughout history.
Time Period
18th-21st Centuries
Grade Level
3 – 6
Selected Sources
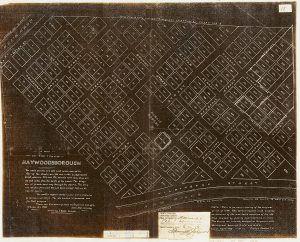
1799 Haywood Map [1908, 1799]
Haywood, North Carolina (Chatham County), 1908
Some maps can give us information about what towns or areas used to look like. This map, created in 1908, was traced from a printed map originally from 1799. It shows the layout of the town of Haywood in Chatham County, North Carolina and was created just a few years after the town was founded. It features the main streets and town square. Throughout its history, the town of Haywood has grown and shrunk, and little of the original town structure remains today.
Contributed to DigitalNC by Chatham County Historical Association
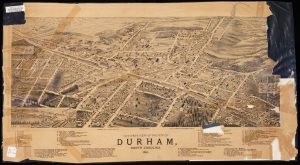
Bird's Eye View of the City of Durham, N.C. (1891)
Durham, North Carolina (Durham County), 1891
This map offers a bird’s eye view of Durham, North Carolina. It features city landmarks, street names, and prominent buildings throughout the city. When it was created in 1891, the city of Durham was only about 20 years old and most of the buildings in the city were built close to the railroad tracks.
Durham is known for its involvement in the tobacco industry. At the same time, an area in Durham became known as Black Wall Street because of the many Black-owned businesses on and around Parish Street. This map was created by the Burleigh Lithographing Establishment.
Contributed to DigitalNC by Durham County Library
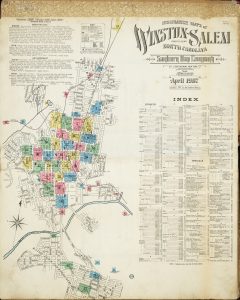
Sanborn Insurance Maps of Winston-Salem, North Carolina (1907)
Winston-Salem, North Carolina (Forsyth County), 1908
For about 100 years, the Sanborn Map Company created maps of towns and cities throughout the United States. These maps helped insurance companies locate areas and buildings that were in danger of having fires that could damage property or potentially hurt people. These maps use symbols and colors to share information. Guides can help piece together aspects of the map to understand the information on the map. This is a map of Winston Salem, North Carolina and was created in 1907.
Contributed to DigitalNC by Forsyth County Public Library
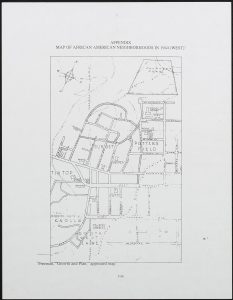
Map of African-American Neighborhoods in Chapel Hill [1944]
Chapel Hill, North Carolina (Orange County), 1944
Some of the oldest neighborhoods in Chapel Hill, North Carolina are featured in this map. They are called Tintop, Northside (Sunset on this map), and Pine Knolls (Knolls on this map). These neighborhoods are known as historically Black neighborhoods of Chapel Hill and Carrboro, because these are the areas where African American people were legally allowed to live at the time. During this time period, neighborhoods, businesses, and towns like Chapel Hill were segregated by race.
Contributed to DigitalNC by Chapel Hill Historical Society
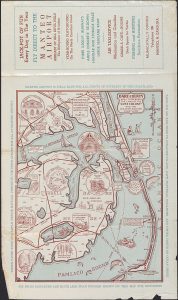
Manteo Airport Brochure [circa 1959]
Manteo, North Carolina (Dare County), 1959
Maps are sometimes created to encourage people to visit a location. This map was created by the Manteo Airport. It illustrates the different types of things people can do in the town of Manteo, North Carolina. Manteo was named after a Croatan chief who lived in the area when English colonizers arrived in 1584. The map highlights attractions including the Lost Colony of Roanoke Island, various places to hunt in the area, and local memorials to the Wright Brothers.
Contributed to DigitalNC by Ocracoke Preservation Society
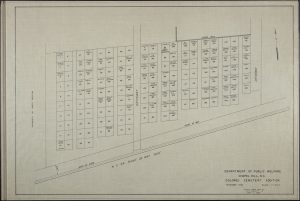
Department of Public Welfare Chapel Hill, NC Colored Cemetary Addition [1960]
Chapel Hill, North Carolina (Orange County), 1960
During the late 19th and early 20th centuries, neighborhoods, businesses, schools, and even cemeteries were legally segregated by race. This map was created in 1960 by the Department of Public Welfare in Chapel Hill, North Carolina. Its purpose was to show an addition to the Chapel Hill town cemetery. This addition was specifically for Black families and Black individuals. At the time, the term “colored” was used widely by white people to describe people of African-American descent.
Contributed to DigitalNC by Chapel Hill Historical Society
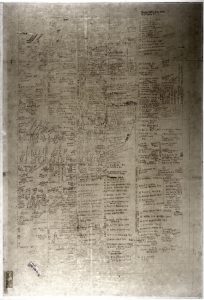
A Map of Gastonia dating back to 1895 [1972]
Gastonia, North Carolina (Gaston County), 1972
While a lot of maps use lines and shapes to share information about a city, some maps use other visual techniques to tell the viewer about a place. This map was created in 1972 and illustrates central Gastonia through the names of residents and businesses. Each name is placed on the map where that specific person lived or a business existed in the layout of the town. It was inspired by the memories of Giles Smith, who was born on December 13, 1890. Gastonia is historically known for textile manufacturing.
Contributed to DigitalNC by Gaston County Public Library
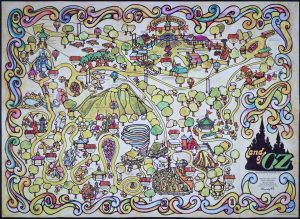
Land of Oz Map (1975)
Beech Mountain, North Carolina (Watauga County), 1975
Beech Mountain is a town in the Blue Ridge Mountains of North Carolina. It is the highest town in the eastern United States. Many people from North Carolina and other states travel to Beech Mountain to go skiing and snowboarding.
In the 1970s, it also became known for a theme park called Land of Oz. The theme park was designed by Jack Pentes and was inspired by the children’s story, The Wizard of Oz. Pentes noticed a lot of similarities between the landscape of Beech Mountain and the fictional land of Oz. Just like the children’s story, the theme park featured a yellow brick road, a haunted forest, and an Emerald City. This map was created by the Carolina Caribbean Corporation in 1970 and illustrates the layout of the Land of Oz theme park.
Contributed to DigitalNC by Watauga County Public Library, Appalachian Regional Library
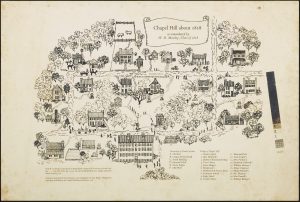
Chapel Hill in 1818 as remembered by W.D. Moseley (1976)
Chapel Hill, North Carolina (Orange County), 1976
The town of Chapel Hill and the University of North Carolina at Chapel Hill (UNC-CH) were both founded in the late 1700s. At the time, the town looked very different than it does today: people traveled in horse-drawn carts instead of cars, roads like Franklin Street were often made out of dirt, and the university was housed in one single building instead of the large campus it is today.
This map gives us information about what the town of Chapel Hill looked like in the early 1800s. In 1856, a student from the UNC-CH Class of 1818 named W.D. Moseley described the town based on his memories. The description he provided inspired the drawing of this map, which was published in 1976.
Contributed to DigitalNC by Chapel Hill Historical Society

An Outdoor and Tourist Guide to North Carolina
North Carolina, 1970
This map tells us about the outdoors landscape of the entire state of North Carolina. It was created by the North Carolina Department of Conservation and Development for visitors to the state. There are wildlife symbols, photographs, and illustrations. The creators of this map hoped the map would encourage people to explore different areas of the state while learning about animals, parks, and landmarks.
Contributed to DigitalNC by Granville County Public Library
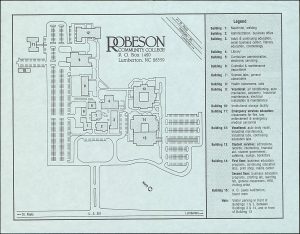
Robeson Community College Building Map [2002]
Lumberton, North Carolina (Robeson County), 2002
While most maps in this collection feature towns, cities, or large geographic locations, this map shares information about Robeson Community College in Lumberton, North Carolina. It provides information about both the layout of the campus, as well as the types of academic departments the college offers. A map like this could be used by students and visitors to campus.
Contributed to DigitalNC by Robeson Community College
Background
With the invention of the printing press in the 15th century, maps became a popular tool for documenting geography and understanding the world. The first maps of North Carolina during this time were by sailors using maps to record information about the North Carolina coast. Some of the earliest maps focus on British settlements around Cape Fear and the surrounding Native American communities. The maps you will see here are influenced by European cartography (or mapmaking) practices.
Maps have a lot of information. They are often flat representations of a place that use symbols to illustrate where things are located. Landscapes, roads, weather patterns, and animal habitats are a few examples of information you might find on a map. You may also find a key, a title, and a scale to help you better understand the map’s context and the meaning of certain symbols. If you think about all of the parts of a map together, it will be easier to understand. Knowing a map’s historical time period, its creator (a cartographer), and the people for whom the map was made can also help you understand a map.
Discussion Questions
What do you see in this map?
What area of North Carolina does it represent?
What type of map is this? What type of information does it feature (geographic, economic, topographic, etc.)?
Are there aspects of the map that clue you into its time period, social context, or purpose?
Does the map have any informational features (scale, annotations, key)? What kind of context do these features provide?
What type of materials or tools might have been used to create this map?
Can you find a current, digital map of the same location? What similarities and differences do you notice?
These materials were compiled by Sarah Costello Dwyer. Updated September 2024.
https://www.digitalnc.org/primary-source-sets/analyzing-maps/
This document was prepared for print on August 29, 2025.